
Crypto Bonus of up to 25% when depositing funds by cryptocurrency. You can get from 5 up to 30,000 USD for trading.
Types of charts on Forex
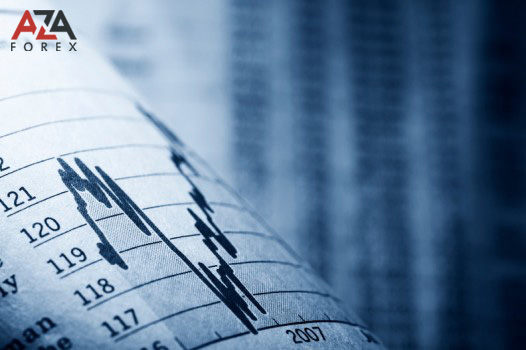
Types of charts on forex trading terminal
Graphics is a necessary and important tool for a trader of the market. There are several options for how to build charts on forex. Such methods allow displaying information on quotations in the international currency market. This is important for the player since he actively and widely applies graphics as a means for conducting a technical analysis of the market, for forecasting and making correct trading decisions. The charts themselves are created in two coordinate systems: they are built based on price and tick quantity data (vertical y-axis) and the presence of a time interval (horizontal x-axis).To create forex charts(except for tick charts)traders and analysts use the following characteristics:1) the opening price of the period - the price that formed at the beginning of the trading period;2) the closing price of the period is the same as the opening, the price that formed at the end of the trading period;3) the maximum price of the period is the highest value that was recorded for the entire trading period;4) the minimum period price is the lowest price, which was fixed for the whole trading period.
As for the trading period, time interval or timeframe, this is the time interval that is used to create charts. Having sufficient information - data, you can safely group it and provide it as a graph. If we talk about the trading terminal, then the trader has the opportunity to use such timeframes - 1 minute, 5 minutes, 15 minutes, 1 hour, 4 hours, 1 day, 1 week, 1 month. There are several basic methods for charting: each of them is focused on a trader and is aimed at giving all possible data and facilitating an understanding of the market situation that was created at a given (certain) moment. Let us now turn to a more detailed examination of the types of graphs:1. Tick chart this is the schedule of the smallest scale: it shows single price changes. It is not tied to the time interval and is created in real-time: it is generated with each change of quotation. The upper area is responsible for the price of Ask, the lower one for the Bid price. This option can not be used for market analysis, based on it you can determine a specific point - the input or output provided that the main graphic data is already calculated2. Linear graph create this type of chart, only closing prices for past trading periods are needed: they will be used as opening prices for new periods. The prices are connected by a line, and the graph on output has the form of a curve. This version of the schedule is designed for small time intervals. Based on it, there is no way to determine and evaluate price changes within the period itself (there is simply no data on the prices of the maximum or minimum). Of course, the relationship between price ranges (in the period itself) is an omission.3. Graph of bars to build this chart, we need the prices of the maximum and the minimum, which are combined by a vertical line. On the line itself, the opening price and the closing price for a fixed period are reflected. The main advantage is that you can observe the price changes within the time interval.4. Japanese candles this kind of graph is built like the previous one. A characteristic fact is the body of a candle. This is the distance that is formed between the opening prices and closing prices. In case the session closing price was lower than the opening price, the body will be painted black. If the closing level is higher than the opening level, the body will be white. Black is a bearish colour, white is bullish. In the trading platformMT4all varieties of charts are formed at the bid price(except for teak). On the tick, you can see two prices.

The player actively and widely applies graphics as a means for conducting a technical analysis of the market, for forecasting and making correct trading decisions.
Promotions
Loyalty bonus
The first step to managing additional assets.

AZA can increase your trading funds 120% on the account with the help of the Loyalty Bonus.
CD Bonus
It's more than can give your bank!

This offer is available to all clients and is valid for one new personal or corporate account opened before December 31, 2022.
Forex Rebate
Trade with Extra profit!

Earn from your trading and get up to 30% of the traded spread to your trading account.
Latest Posts
-
Lessons as a Beginner
- Aug 09, 2023 -
Introduction
- Jul 15, 2023 -
AZAforex and Investfox form a partnership.
- Jun 27, 2023 -
Trading psychology
- Jun 15, 2023 -
7 important people
- Feb 25, 2023
Binary Options

Market Analytics

 aza youtube
Profitable trading recommendations, forex analytics for beginners traders
Subscribe our channeltop authors


")


